The user interface for Operations Sentinel Console displays all information within two windows: the main Operations Sentinel Console window and the Alerts window.
Main Window
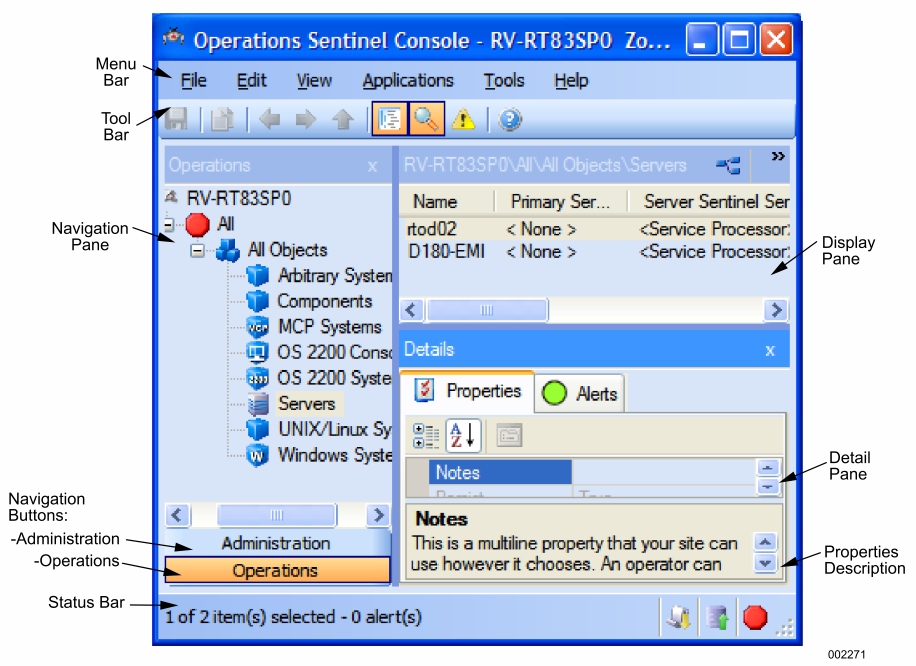
The main window contains a navigation pane, a display pane, details pane, menu bar, tool bar, and status bar. See Figure 1–1. Each portion of the main window, except the display pane and menu bar, can be displayed or omitted at your discretion.
Navigation Pane
The navigation pane allows you to switch between administration and monitoring tasks by clicking the Administration or the Operations buttons. For each of these, the tree structure within the navigation pane allows you to open specific displays.
Administration Button
Displays the tasks you can perform in an expandable tree. Use the Administration button to
Create, modify, and distribute resource monitor policies for Windows, UNIX, and Linux systems. Enable and disable use of a resource monitor policy on a Windows, UNIX, or Linux system.
Define managed objects.
Define managed groups.
Define zones.
View and set the active alert policy.
Create and modify alert policies
Create and modify launch definitions for external applications.
Configure a policy for logging into control the storage of log files.
Enable and disable logging of specific log sources.
Only users in the SPO Administrators role have full access rights to view, create, and modify data. For users in other roles, their rights to create and modify data depend on the permissions granted to their role.
Operations Button
Displays the current state of the monitored objects (servers, systems, and consoles). It also provides the means to launch applications such as terminal windows and external applications for specific objects.
Use the Operations button to
Select the zone you want to monitor.
Monitor connection states of devices using topologies and tables.
Handle alerts
Launch applications to deal with arising problems.
The highest-level node in the pane is the Operations Sentinel server node. This indicates the server that is monitoring managed systems. You select the server when starting Operations Sentinel Console. A plus sign (+) beside a node indicates an item that can be expanded. A minus sign (-) indicates an item that can be contracted.
Display Pane
The display pane provides various ways to display objects including tables and topologies. The display pane also provides context menus for opening auxiliary applications, such as console windows, terminal windows, remote desktops, log viewer, and external applications.
Details Pane
The details pane allows you to view all details of a specific object, or common details of a selected set of objects. During administration, it also provides the means to change the properties of systems and other objects.
Menu Bar, Toolbar, and Status Bar
The menu bar provides access to all operations that you can perform using Operations Sentinel Console. The menu bar varies depending on which node you have selected in the navigation pane and which items you have selected in the display pane.
The toolbar displays icons that provide one-click access to common operations. The contents vary depending on what is selected in other panes.
The status bar contains icons for
The active SP-AMS database
The active alert policy
The severity of the most severe, unseen, alert for the zone you are monitoring
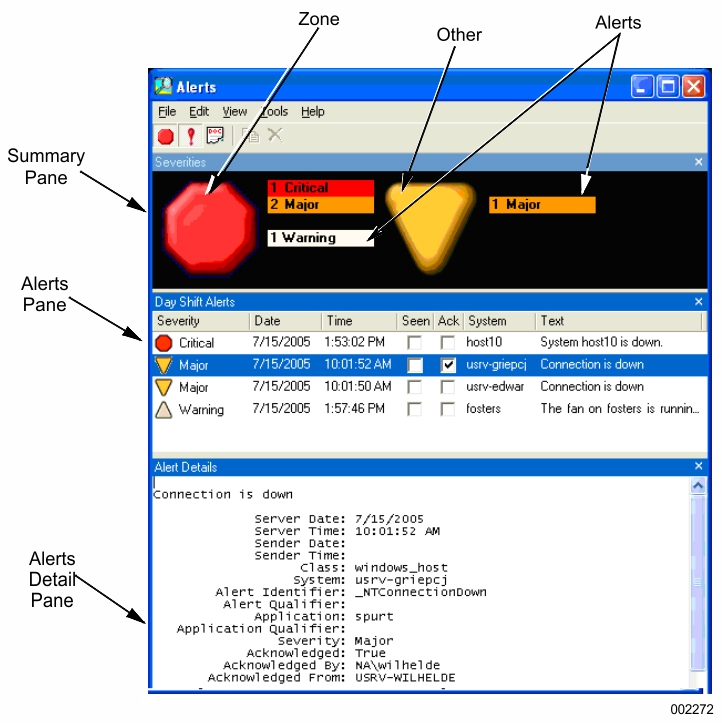
Alerts Window
The Alerts window is separate from the main window of Operations Sentinel Console. The window contains a summary pane, an alerts pane, and an alert detail pane. Figure 1–2 shows the Alerts window with full display. All portions of the Alerts window can be displayed or omitted. You can size it, locate it on the screen, and minimize it independently of the main window. You can also choose an option to have the Alerts window appear in front of all other windows on the workstation screen.
You can display the following items in the Alerts window:
Summary Pane
Contains the Zone Alerts and the Other Alerts icons, as well as alert severity bars
Alerts Pane
Contains a table of either the alerts for all systems in the open zone, or the alerts for all systems not in the open zone
Alert details pane
Displays information about the alert.
Alert Information
An alert icon next to each zone node in the navigation pane indicates the most severe unseen alert applicable to that node.
An alert icon in the status bar indicates the most severe unseen alert for the open zone.