The following Microsoft Visual Studio Windows display information about the current debug session:
Call Stack
The Call Stack window displays methods and method parameters currently on the call stack of the Debugger.
Breakpoints
The Breakpoints window displays all defined breakpoints for the solution.
Autos
The Autos window displays all variables referenced in the current method logic, including the executing object ('this') and the individual attributes of a complex class or group. It also displays the owning component (the segment) of the executing object. This includes Glb, providing access to the Glb.Status and Glb.Error built-in segment attributes.
The Autos window supports array indexes and methods as valid expression.
To edit the value of a listed variable, type the required value directly in the Value field of the variable or use the Immediate window.
Locals
The Locals window displays local variables and parameters of the current method, including the executing object ('this'). It also displays the individual attributes of a complex class or group. The Locals window supports array indexes and methods as valid expression.
To edit the value of a listed variable, type the required value directly in the Value field of the variable or use the Immediate window.
This
The This window displays the executing object ('this'). It also displays the owning class (‘owner’) of the executing object if there is one, and of the owning component (the segment) of the executing object. Note in all these sections, ‘component’ is a keyword like ‘this’ and ‘owner’
To edit the value of a listed variable, type the required value directly in the Value field of the variable.
Watch1, Watch2, Watch3, Watch4
The four Watch windows display user-specified variables and the individual attributes of a complex class or group. You can use the Watch windows to monitor or manipulate your choice of variables. For example:
The Watch window supports array indexes and methods as valid expressions.
To add a variable to a Watch window, type its name directly in the Watch window. You can also drag-and-drop or copy-and-paste a variable into the Watch window.
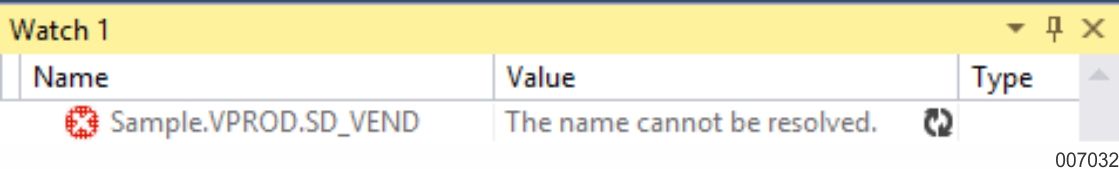
Note: When you drag-and-drop or copy-and-paste a variable, you might notice that the fully qualified name of the variable appears instead of only the attribute in the Watch window. The AB Suite Debugger cannot read the attribute from the fully qualified variable. Therefore, you need to manually edit the variable name to display only the attribute and its value.
For example:
After a fully qualified variable is copied to Watch window, the value of variable is not displayed as shown below.
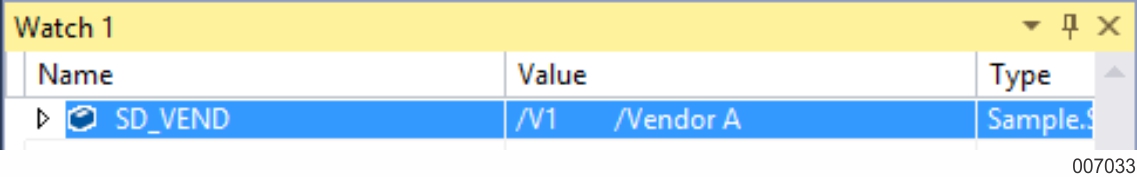
After editing the name of the variable to display only the attribute, the value is displayed as shown below.
To remove a variable from a Watch window, select the variable in the Watch window, right-click, and select Delete Watch.
To edit the value of a listed variable, type the required value directly in the Value field of the variable.
Note: You can also use the Immediate window to add, remove, or edit values in the Watch window.
Search Debugging User Interface Reference in the Microsoft Visual Studio Online Help for more information on the Debugger windows.
Immediate Window
The Immediate window allows you to perform tasks, such as debug and evaluate expressions, print variables, and execute statements. This window also allows you to enter expressions to be executed and assign values to the variables.
For example,
To display the value of an attribute in an array, (for example, Variable1) in the Watch, Auto, or Locals window, execute the following command:
>Debug.Print Variable1
This command prints the string representation of an attribute in the array Variable1.
The Immediate window supports array indexes and methods as valid expression.
Refer to the Microsoft Visual Studio Online Help for more information on Immediate window.
Stack Frame
The Stack Frame drop-down list displays the methods and the method parameters currently on the stack.
Threads Window
The Threads window displays a single thread that is associated with a program you are debugging. By default, the name of the thread is Main Thread. This window also displays the location of the thread, similar to the Call Stack window and Stack Frame
Modules Window
The Modules window displays a single module that is associated with a program you are debugging.