Following are the two ways to initiate debugging:
Start (F5)
On pressing F5, the debugger is initiated and will break only on user break points
Step Into (F11)
On pressing F11, the debugger is initiated and will break on the first line of logic of the selected object
Before you initiate a debug session for an AB Suite application, select the configuration. The top-level folder must be deployable within this configuration.
Right-click the Deployable Folder in Class View and select Properties.
Under Build Target Filter, set Deployable to True and set Deploy Application Components and Deploy Database to True.
Note: It is not necessary to use a separate configuration defined specifically for Debugger. You can use any host platform configuration.
To initiate a debug session for an AB Suite application, you must first select an element that you want to debug, and then click Start from the toolbar, or press F5 or F11, or right-click the element and click Debug:
If you want to debug the online system, select the Segment.
If you want to debug a report, select that report. Alternatively, you can debug a report by running it from within an online system debug session.
If you want to debug a Messenger class using the Messenger Client, select that Messenger class.
If you want to debug a public segment method, select that method in the members pane of the Class View.
If any other element types are selected, or no element is selected, the default action is to start an online system debug session.
Default Configuration Settings
Following are the default configuration settings for the model element. However, you can modify the following default settings on the Configuration Properties dialog box if you want to do so.
For an AB Suite User Experience mode model project, WPFClient details are automatically populated in the Client configuration properties fields.
For an AB Suite Advanced mode model project, Client configuration properties will remain blank, indicating that the “Winform Container” or “Messenger Client” will be used depending on the selected element.
For a custom client, that is External Application or MessengerClient, specify details in the Client configuration properties section.
To know more about Configuration Settings, refer to Debugger Configuration Properties.
If the Reorganize Database property is set to No, the debug session is started without reorganizing the database. Refer to Logical Reorganization for more information on debug session behavior when the database is not reorganized.
To run a debug session
Once started, a debug session can be controlled using the commands listed in the following table, which are available from the Debug menu or toolbar.
| Command | Description |
|---|---|
| Break All | Halts logic execution before interpreting the next logic statement. |
| Stop Debugging | Terminates the debug session. |
| Continue | Resumes logic execution. |
| Step Into | Interprets the next logic statement, or enters a method call in the statement, before stopping logic execution. |
| Step Over | Interprets the next logic statement, including logic in any methods called by that logic statement, before stopping logic execution. |
| Step Out | Interprets logic until the current method returns, before stopping logic execution. |
| Run To Cursor | Interprets logic until the logic statement on the selected line in the logic editor is reached, before stopping logic execution. |
Debugger Report Viewer
You can use the Debugger Report Viewer to view the report XML outputs that were previously generated during debugging and then display the output in the default browser.
The Debugger Report Viewer is part of the AB Suite Developer.
To view any report by using the Debugger Report Viewer, perform the following:
On the Start menu, point to AB Suite 7.0 , and then click DebuggerReportViewer.
The Debugger Report Viewer dialog box appears.
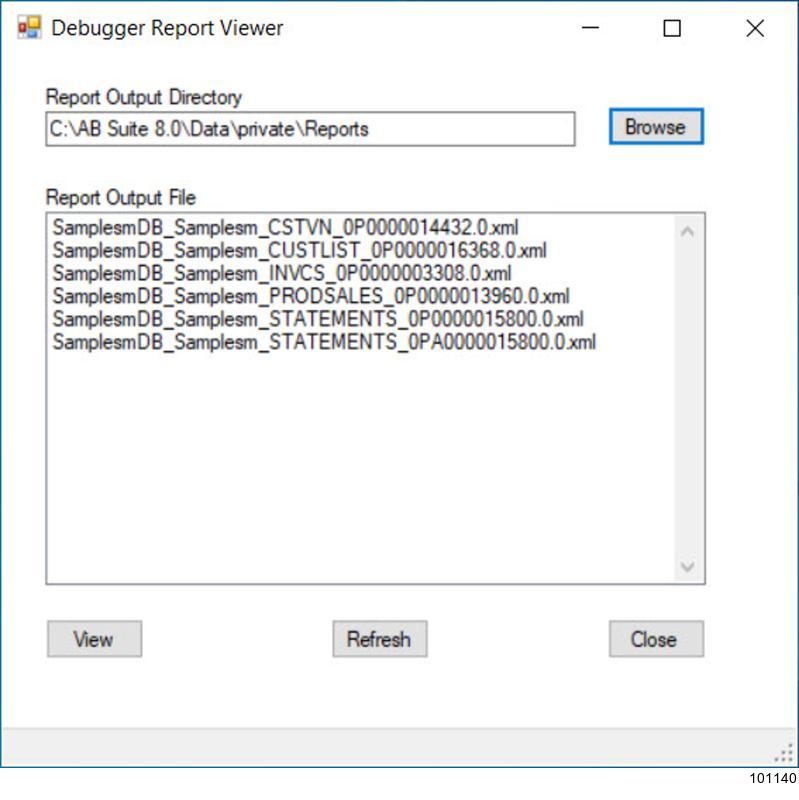
In the Report Output Directory box, enter the path or browse to the folder where the report XML outputs are saved.
The Report Output File box lists the previously generated report XML outputs.
Click Refresh to view the list of the latest report XML outputs.
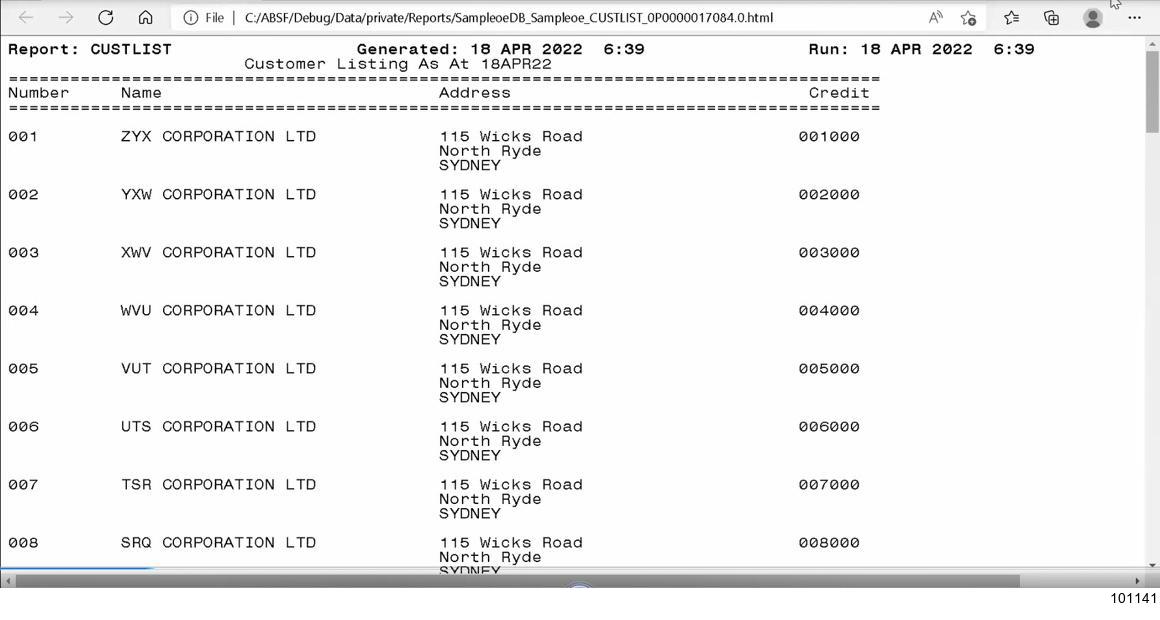
Select the report XML output that you want to view and click View.
The report XML output information is displayed in the browser.
You can select multiple report outputs to view the information for multiple report XML outputs in separate browser windows.
Click Close to close the Debugger Report Viewer dialog box.
Note:
In the Debugger Report Viewer, you can only view the information for report XML outputs that were generated by AB Suite. You cannot view the information for any other XML files.