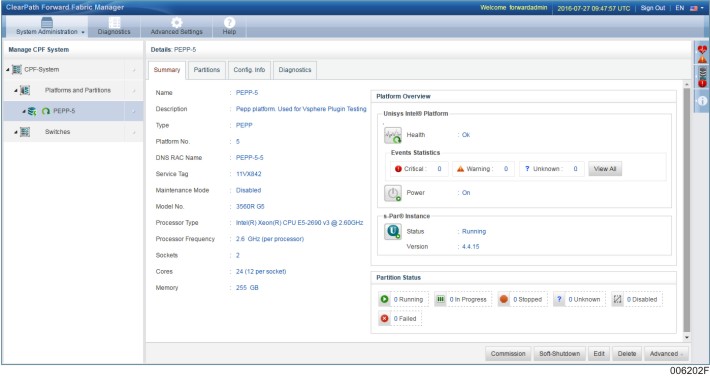
The following table describes the various attributes of the platform that you can view on the platform summary:
| Attribute | Description | Example |
|---|---|---|
Summary | ||
Name | Denotes the name assigned to a platform when it is added to the fabric. | BankA |
Description | Provides the description of a platform when it is added to the fabric. | This platform contains all the banking applications related to BankA. |
Type | Describes the type of the platform when it is added to the fabric. The values can be NEPP or PEPP. | PEPP |
Platform Number | This number is a unique numerical value that a user or the Fabric Manager assigns to a platform when it is added to the fabric. The number identifies the platform internally. The value ranges from numbers 1 to 16. | 5 |
DNS RAC Name | Denotes the Domain Name System Remote Access Controller name. It is a combination of platform name and number. It is defined automatically when a platform is added to the fabric. It is displayed in the web page header when you access the platform management console of the platform. Note: Since the Fabric Manager does not use the DNS, it cannot be used to access the platform management console. To access the platform management console, use the IP address of the platform. | BankA-5 |
Service Tag | Indicates the unique number of the platform hardware provided by the manufacturer. In the Call Home, this number is referred as platform serial number. It is a key identifier for the maintenance entitlement. You can reference this number when approaching Unisys for the support. | DWC4KY1 |
Maintenance Mode | Defines the status of the maintenance mode. It is enabled when maintenance activities are carried out on the fabric. | Disabled |
Model No. | Displays the model number of the platform. | 3560R G3 |
Processor Type | Denotes the processor brand, product line, model number, and operating frequency. | Intel(R) Xeon(R) CPU E5-2667 v2 @ 3.30GHz |
Processor Frequency | Indicates the platform processor frequency. | 3.3 GHz (per processor) |
Sockets | Defines the number of sockets supported by the platform processor. | 2 |
Cores | Defines the number of cores supported by the platform processor. | 16 (8 per socket) |
Memory | Indicates the total memory available in the platform. | 127 GB |
Platform Overview | ||
Health | Denotes the status of the platform health. It can be one of the following: Unknown: Indicates that the Fabric Manager is unable to understand the status of the platform. Ok: Indicates that there are no issues found in platform. Warning: Indicates that the platform needs the attention. For example, Warning is displayed when the platform has an unsupported Software or Firmware version. Critical: Indicates that the platform needs immediate attention. For example, Critical is displayed when the temperature of the platform has exceeded the threshold value. This might cause a hardware failure. | Ok |
Events Statistics | Displays the number of critical, warning, and unknown events. Click on an event type to see all the events of that particular type that are generated for the platform. Click on View All to see all the events that are generated for the platform. Note: The Nagios events do not impact the platform health. If the Nagios events are generated on a platform, then the Event Statistics of that platform indicates the critical events. However the platform health status still remains Ok. | |
Power | Indicates the status of the platform. It can be either On or Off. | On |
s-Par® Instance | Denotes the version number and status of the s-Par® instance. The status can be either Running or Stopped. Notes:
| Running |
Partition Status | Displays the count of partition images that are in various states such as "Running", "Stopped", "Disabled", "In-Progress", "Unknown", and "Failed". | |
To view the platform summary
On the Fabric Manager user interface, point to System Administration, and then click CPF System.
The Details: CPF-System screen appears on the right pane.
Click Platforms and Partitions.
The Details: Platforms and Partitions screen appears on the right pane.
On the Platforms tab, double-click the platform of which you want to view the summary.
The Details: <platform name> screen appears.
Click the Summary tab.
The summary of the platform appears.