You can view the list of events logged on the Event Console. Fabric Manager allows you to store the events for a maximum period of 180 days. However, you can set the event log retention period. For more information about setting the event log retention period, see Editing the Event Log Retention Period.
To view the events and alerts, on the Fabric Manager user interface, click Diagnostics.
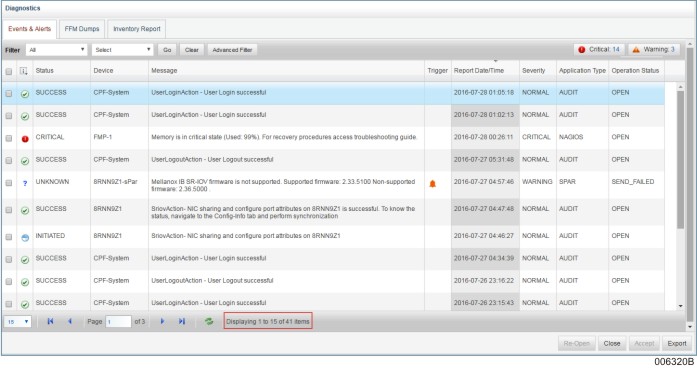
The Event Console appears with a list of events. To know more about the information displayed on the Event Console, see Interpreting Event Console Information.
To view more information about an event, click the Details icon under Details column of the desired event. The View Event Details window appears.
The Event Details for general events include the following information in the General Info. tab:
User: The user id of the person who is logged-in to the Forward Fabric Manager.
Device: The source (platform or partition) that reports the event. For example, CPF-System.
Message: Detailed description of the event that occurred.
Role: Role assigned to the user id used to login to Fabric Manager.
Status: An indicator of the condition of the entity reporting the event.
Reporting Date time: Time stamp of when the event occurred. Severity: The value that describes the criticality of the event as reported by the device. For example, Critical, Warning, and so on.
Application Type: The application reporting the event. (Audit, s-Par®, IPMI_SEL, sPAR and so on).
Message Count: Count of occurrence of a particular event. If similar events occur multiple times, the Fabric Manager consolidates them into a single event. This consolidation feature reduces the number of similar events being displayed in the Event Console. When the same event is reported multiple times, this value is incremented until such time the event is closed or occurs within the set consolidation time limit. The default value is zero seconds and the Fabric Manager does not perform the consolidation of events that are similar. You can set the consolidation time to a different value. To do this
Using the Remote Desktop or an SSH client, such as PuTTY, log into the FMP Desktop and open a new terminal session.
Open the time consolidation configuration file by executing the following command:
vi /usr/local/ffm/nagios/etc/callhomeProperties.conf
In the configuration file, set the “callHomeDelay” and “thresholdTimeLimit” to a desired value in seconds.
Ensure that the "callHomeDelay" value is equal to or lesser than the " threshholdTimeLimit" value.
Save the file and restart the Fabric Manager services by executing the following command:
rcffmservices
restart.
Operation Status: The condition of the event itself, based on the action taken on the event. For Example, Open/Close/Accepted/NACK/SACK/Send In-Progress/Send Failed/Pending.
Requestor: IP address of the system from where the action is triggered or the user is logged in.
The following is a sample Event Console:
If the event type is warning or informational, then the View Event Details window displays the Troubleshooting Info. tab.
The Troubleshooting Info. tab displays information such as event ID, severity, event code, possible causes, and possible solutions.
The Event Details for Call Home events include the following information:
General Info: Along with the information provided for general events, call home events have the Call Home Acknowledgement.
Control: Provides information on the data packets sent.
Customer: Provides the customer name, address and contact number.
System Data: Provides the system style and serial number, the version of call home, information about the source computer and the computer sending the events.
Event Data: Provides event details such as the time of event generation, the problem caused, the type of alarm, probable cause and severity of the problem.
Extended Text: Provides detailed description of the problem and the actions taken to resolve it.
FRU List: Provides the Unit Serial Number of the Partition/Platform.
If the event is related to switch, it also has FRU ID and Part number, which are required for diagnostics. The Unit Serial No is not applicable to a switch.
Partition Info: This tab has the partition details such as the Partition ID, its state, the OS running on the partition and whether the partition has stopped.