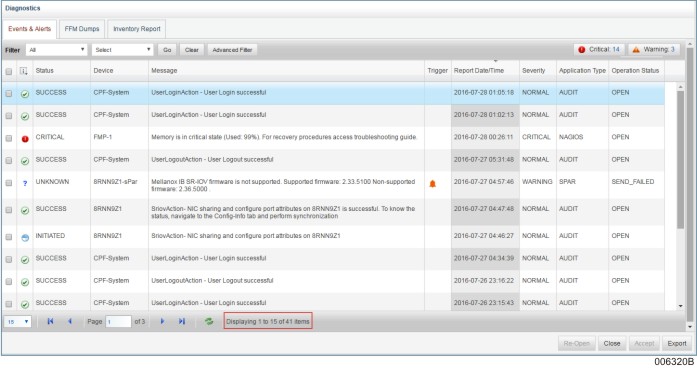
The Fabric Manager allows you to filter and display only the required events in the Events console. Using the filters, you can view a specific type of event such as platform events, partition evens, and so on, or you can view all types of events. You can also view the events that contain a specific value that you have set in the filter.
The following table describes the filter settings that can be used to view the events based on various types and criteria:
To view… | Do this… | Remarks |
|---|---|---|
Events by type. For example, platform, partition, secure fabric, and so on. | In the first drop-down, select the appropriate event type, and in the second drop-down list, select the appropriate event criteria. If prompted, select an appropriate value in the third drop-down list. For example, if you wish to see the events related to the platforms that are in Critical status
| For some event types, you can see all the events by selecting the event type in the first drop-down list and then clicking Go. |
Events by criteria. For example, Status, Message, Device, Severity, Application Type, Report Date, or operation Status. | In the second drop-down, select the appropriate event criteria, and in the third drop-down list, select or type an appropriate value for the selected event criteria. For example, if you wish to see events related to all the devices that have message related to sPar
| |
All events pertaining to a specific device. For example, all events related to a specific secure fabric. | In the first drop-down, select All, and in the second drop-down list select Message. In the third field, type the secure fabric name for which you want see all the related events. For example, if you wish to see all the events related to the secure fabric “my secure fabric”
| |
The improved error messages for failed events. | In the first drop-down, select All, and in the second drop-down list select Status. In the third field, select Failed. For example, if you wish to see all the events whose status is failed,
|
Note: Closed and Accepted events are not displayed in the event console by default. You can see them only by setting the appropriate filters.
Example
A filter is applied to view the events related to platform PEPP1. When the filter is applied, the event console displays:
All the 10 events related to PEPP1.
Events related only to the platform PEPP1.
More Information
You can also perform the following actions in the Events Console:
Hide the columns that you do not want to view: To do this, select the drop-down arrow on the column that you want to hide, and then unselect that column from the list.
Widen the Message field, so that you can view the complete message.
Customize the events list using the Advanced Filter option. This option allows you to filter the events based on resource type, device name, status, severity, and so on.