The FFM Server Health pane displays the health status of the Fabric Management Platform (FMP).
Additionally, the pane displays the health status, percentage utilization, and the current status (whether in running or stopped state) of the server resources.
To launch the FFM Server Health pane, click the server health status icon on the Fabric Manager user interface. The FFM Server Health pane slides out.
Note: The health status icon depends on the health status of the master node. For example, if the health status of the master node is Warning, the slider icon reflects the Warning status and displays the icon that represents the Warning status.
The following figure is an example of the FFM Server Health pane:
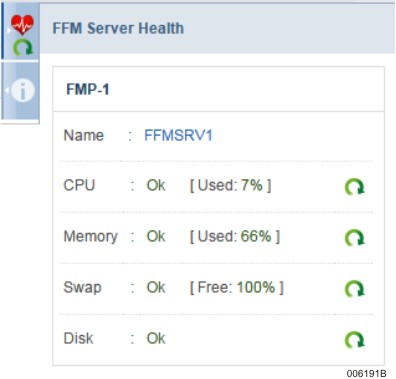
Understanding FFM Server Health Pane
The FFM Server Health pane displays the following:
The health status of the server (master node) and information about the status of its resources. It also displays the number of different types of events that are logged for the master. Click on the number of events displayed, to view the corresponding critical or warning events in the Events & Alerts tab under Diagnostics.
The health status of the slave node and information about the status of its resources, only if High Availability (HA) is configured on your Fabric Manager. It also displays the number of events that are logged for the slave. Click on the number of events, to view the corresponding critical or warning events in the Events & Alerts tab under Diagnostics.
The Help button in the warning section of the Health Pane, if the overall health of ClearPath Forward Fabric Manager becomes critical or warning. Clicking the Help button redirects you to the Troubleshooting section of the Information Center.
The FMP Manager button in the warning section of the Health Pane, if the Disk status of master or slave node becomes critical or warning. Clicking the FMP Manager button opens the FMP Manager user interface in a new window.
The following table provides a description about each of the resources whose status is considered to decide the health of the master node:
Resource | Description |
CPU | CPU usage in percentage |
Memory | Used memory in percentage |
Swap* | Free swap memory in percentage |
Disk | Used disk space in percentage |
Events | Number of logged events including event type |
*Swap is the memory space used when the physical memory (RAM) is full. If the system requires more memory resources and the RAM is full, inactive space from memory is moved to the swap space.
Consolidation Criteria (For Overall Health):
In (NON-HA)
If at least one resource (CPU, Memory, Swap and Disk) becomes critical, then the overall health is critical.
If at least one resource becomes warning and none of the resources are critical, and even if there are no critical events, then overall health becomes warning.
If all the resources are ok but there is a critical event (IPMI-SEL Event), then the overall health becomes critical.
If at least one resource is Warning and there is a critical event (IPMI-SEL Event), then the overall health becomes critical.
If all the resources are ok but there is a warning event (and no critical event), then the overall health status becomes warning.
In (HA)
Health of an individual FMP is calculated using conditions above, and if any of FMP’s health parameter is critical, then the overall health becomes critical.
Health of an individual FMP is calculated using conditions above, and if any of FMP’s health parameter is warning and none of them are critical, then the overall health becomes warning.
Health of an individual FMP is calculated using conditions above and if the health status of both the FMPs is ok, then the overall health becomes ok.
The following table provides the different possible health status of the master node and the threshold values of the parameters that are displayed for the master node.
FFM Server Health Status Icon | Server Health Status | Parameters | Description | Threshold Value (%) |
 | Normal | CPU (Used) | CPU usage | 1–69 |
Memory (Used) | Memory usage | 1–94 | ||
Swap (Free) | Swap space | >20 | ||
Disk (Free) | Disk space | >15 | ||
Number of Events | Warning | 0 | ||
Critical | 0 | |||
 | Warning | CPU (Used) | CPU usage | 70–79 |
Memory (Used) | Memory usage | 95–98 | ||
Swap (Free) | Swap space | 11–20 | ||
Disk (Free) | Disk space | 11–15 | ||
Number of Events | Warning | > 0 | ||
Critical | 0 | |||
 | Critical | CPU (Used) | CPU usage | >80 |
Memory (Used) | Memory usage | >99 | ||
Swap (Free) | Swap space | <10 | ||
Disk (Free) | Disk usage | <10 | ||
Number of Events | Critical | > 0 |
The following table provides the different possible health status of the slave node and the threshold values of the parameters that are displayed for the slave node.
Server Health Status | Parameters | Description | Threshold Value |
Normal | Number of Events | Warning | 0 |
Critical | 0 | ||
Warning | Number of Events | Warning | > 0 |
Critical | 0 | ||
Critical | Number of Events | Critical | > 0 |