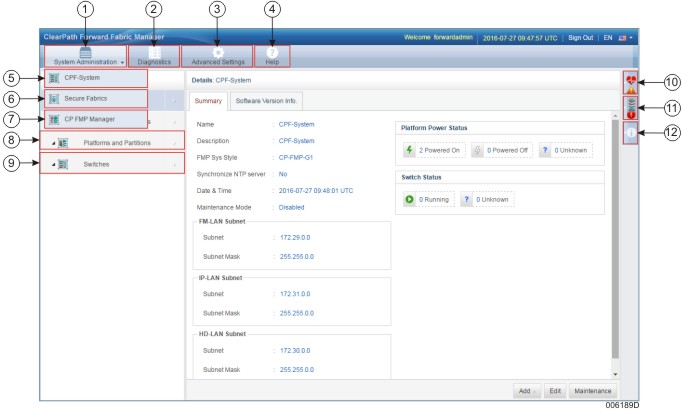
Table 1. Fabric Manager User Interface Components
| Serial Number | UI Element | Description |
|---|---|---|
1 | System Administration | Allows you to choose between CPF System and Secure Fabrics windows. It also allows you to access the CPF FMP Manager user interface. |
2 | Diagnostics | Displays events and alerts, dumps and inventory reports generated by the fabric. Events are a repository of information for all the occurrences in the Fabric Management Platform such as general information or a failure in the system. A dump file is an archive consisting of log files, command operations, configuration files and so on. An inventory report generated by the Fabric Management Platform (FMP) is a consolidated report that contains the Fabric Configuration Inventory details in an xml format. |
3 | Advanced Settings | Allows you to view and manage s-Par firmware, images, blueprints, Call Home email settings, notifications, logs and inventory reports. |
4 | Help | Opens the Fabric Manager Help in a new browser window. |
5 | CPF System | Represents all of the platforms (EPPs) and associated partition images in the fabric. Fabric Manager displays “CPF System” as the default name for the fabric. Note: Based on your requirements, you can change the default system (fabric) name. "CPF System" is synonymous to the default system name you define. |
6 | Secure Fabrics | Displays all the secure fabrics that exist within the fabric. For each secure fabric, it displays information such as name, the physical fabric on which it is created, connectivity type, and so on. |
7 | CP FMP Manager | Opens the FMP Manager user interface in a new window. For more information on the FMP Manager user interface, see ClearPath Forward FMP Manager User Interface. |
8 | Platforms and Partitions | Displays the list of the platforms and partitions and their current state. For each platform and partition, it displays information such as power and health status, type, name, PMC IP address, and so on. |
9 | Switches | Displays the list of switches. For each switch, it also displays the information such as, name, FM LAN IP Address, firmware version, and so on. |
10 | Server Health | Displays health status of Fabric Management Platform. |
11 | High Availability Status | Displays the status of the High Availability cluster. |
12 | Info Pane | Displays the help based on the context. |