Note: The FFM High Availability status is displayed only if you have purchased support for two Fabric Management Platforms (FMP) and configured them as a high availability cluster.
In a high availability (HA) cluster, one of the FMP serves as master node and the other serves as slave node. The FFM High Availability Status pane provides the status of each node and also displays an alert based on the status of both the nodes.
To view the FFM High Availability Status pane, click the HA Status icon on the Fabric Manager user interface. The FFM High Availability Status pane slides out.
The Fabric Manager High Availability Status pane icon is an indicator of the cluster health. It changes based on the health status of the cluster nodes. The following table describes the various states of the cluster and the associated Fabric Manager High Availability Status pane icon:
FFM High Availability Status Icon | Status | Description |
|---|---|---|
| Ok | Both the FMP nodes are running properly. |
| Warning | Status of one of the nodes is Ok or Unknown and the other node is Warning. |
| Critical | One of the nodes is in Critical state. |
| Unknown | Both the nodes are in Unknown state. |


The following is an example of the FFM High Availability status:
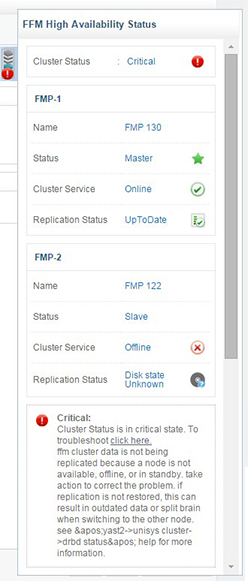
Understanding Fabric Manager High Availability Status Pane
The following table describes various elements of the FFM High Availability pane:
UI Element | Description |
|---|---|
| Cluster Status | Displays the status of the cluster based on the status of the cluster nodes. The status can be one of the following:
|
Name | The name of the HA node. |
Status | This
is the DRBD role of the Fabric Manager cluster nodes. This can be Master, Slave, or Unknown. Master is indicated
by Replication is carried out from the Master to the Slave. |
Launch FMP Manager | Clicking the Launch FMP Manager button opens the FMP Manager user interface in a new window. |
| Displays the health status of nodes based on the severity. The status can be one of the following
Note: The slider icon changes for all health status severity conditions, that is, Critical, Warning, Unknown, and Ok. |

