While a transformation is running, you can monitor the CDT or BDT statistics on the Statistics page. It provides the processing rate chart on the left panel, and the current processing details on the right panel. It also provides information about the audit file that is currently being read. For example, the audit trail number and ABSN are displayed for Enterprise Database Server database.
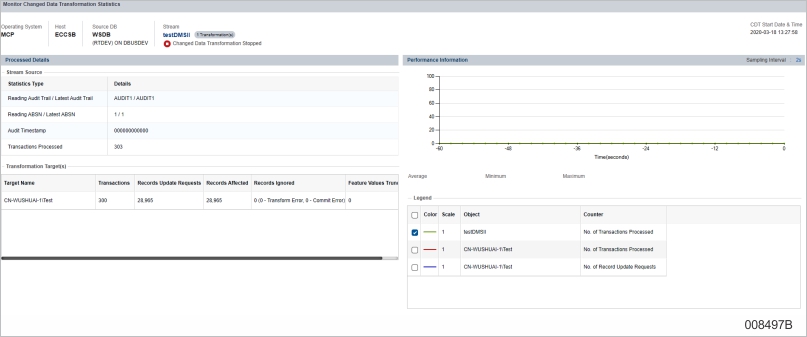
This page automatically refreshes every 2 seconds. The sampling interval can be changed on Settings > Statistics.
You can select the checkbox in the legend pane to show the corresponding lines in the processing rate chart. If you also select a row, it will be highlighted and the corresponding processing line will be emphasized in the processing rate chart. The associated values will show the Average, Minimum, and Maximum values for the last 60 seconds.
For more information, refer to Status on the Statistics Page